Production year
2018

© Fabrice CRIVELLO / IMN - GIN / CNRS Images
20180066_0003
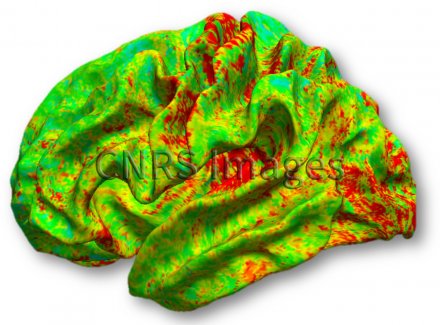
Carte individuelle de la quantité de myéline présente dans le cortex cérébral humain observée en imagerie par résonance structurelle. L’estimation de la mesure de quantité de myéline in vivo est obtenue à partir du ratio de deux images structurelles pondérées respectivement en temps de relaxation T1 et T2 (T1/T2). Plus la quantité de myéline est importante, plus le signal est rouge. Les aires primaires (motrices, auditives et visuelles) ont le plus de myéline, car ce sont les aires cérébrales qui maturent le plus rapidement au cours du développement cérébral.
The use of media visible on the CNRS Images Platform can be granted on request. Any reproduction or representation is forbidden without prior authorization from CNRS Images (except for resources under Creative Commons license).
No modification of an image may be made without the prior consent of CNRS Images.
No use of an image for advertising purposes or distribution to a third party may be made without the prior agreement of CNRS Images.
For more information, please consult our general conditions
2018
Our work is guided by the way scientists question the world around them and we translate their research into images to help people to understand the world better and to awaken their curiosity and wonderment.